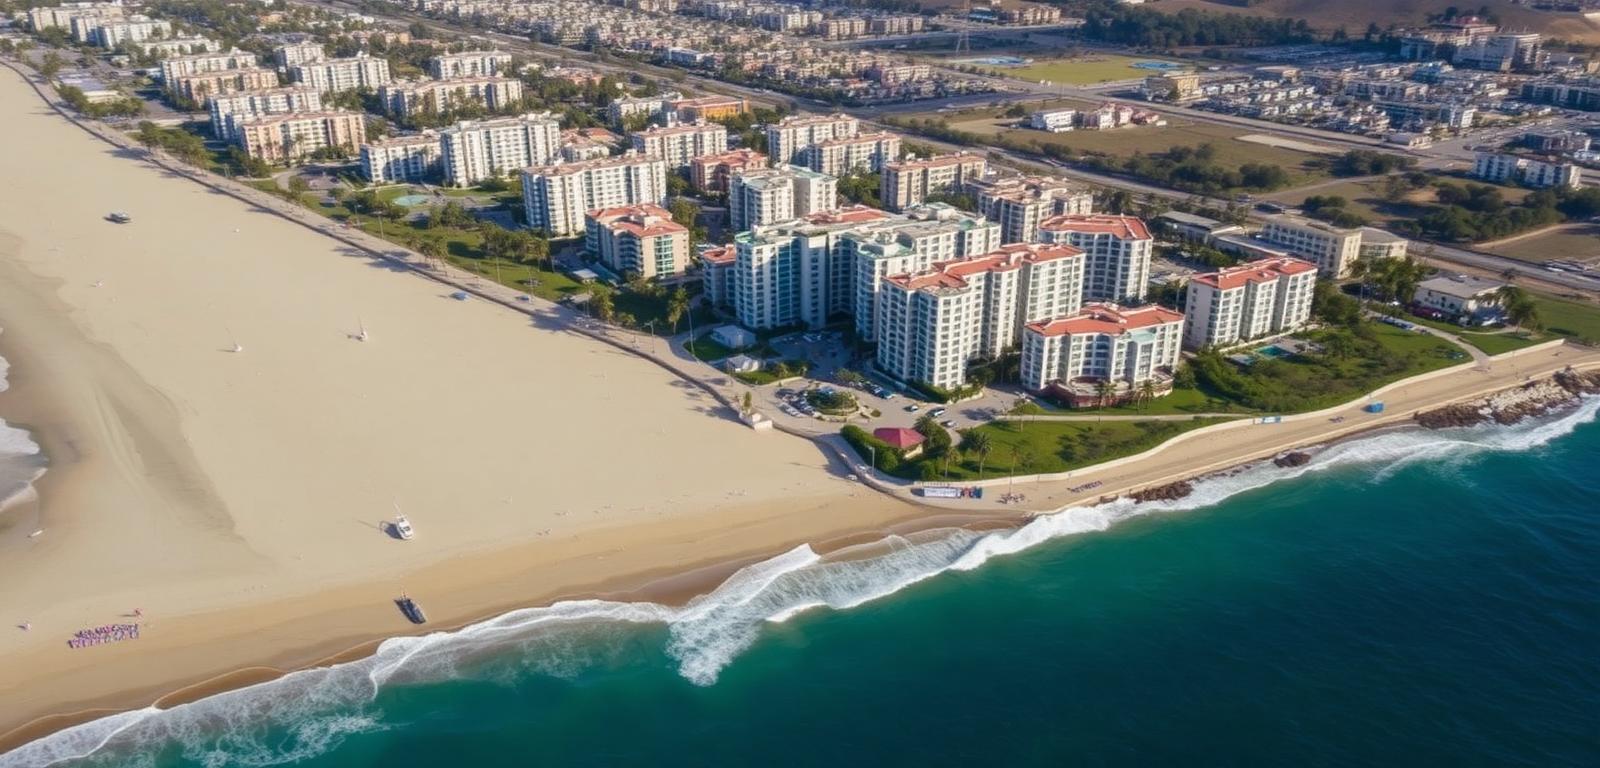
As a multifamily advisor at Lyon Stahl Investment Real Estate, I spend a significant amount of time helping owners and investors make sense of a market that rarely plays by the traditional rules of real estate. Los Angeles is a unique ecosystem. In most markets across the country, a low cap rate implies a premium, highly stabilized asset, while a high price per unit (PPU) moves in tandem with that premium. Here in Southern California, however, these two critical metrics frequently decouple, creating a landscape that can be incredibly confusing for both buyers and sellers.
Understanding the relationship between in-place yield and replacement cost is essential for maximizing your portfolio's performance. Whether you own a fourplex in Venice or a twenty-unit building in Torrance, the way the market values your asset depends on a complex web of local regulations, submarket dynamics, and the current interest rate environment. Let us explore the nuances of cap rates versus price per unit in the Los Angeles multifamily market, and how you can position your investments for long-term success.
The Core Dynamic: Cap Rate vs. Price Per Unit Explained
- Cap Rate (Capitalization Rate): A measure of your property's immediate, in-place yield, calculated by dividing the Net Operating Income (NOI) by the property's purchase price or current market value.
- Price Per Unit (PPU): A measure of your underlying cost basis, calculated by dividing the property's purchase price by the total number of apartment units.
- The LA Divergence: Because of strict local rent controls, many Los Angeles properties feature both low cap rates (due to suppressed income) and low price per unit metrics (offering long-term value-add potential).
To navigate the Los Angeles multifamily landscape, we first need to strip away the jargon and look at what these two metrics actually represent to an investor.
Your capitalization rate, or cap rate, is the pulse of your property's current financial health. It tells a buyer exactly what their unleveraged return on investment will be on day one. If you buy a building for $2,000,000 and it generates $100,000 in net operating income (after all expenses, but before your mortgage payments), you are buying at a 5% cap rate. In a perfectly stabilized, free-market environment, buyers demand higher cap rates for riskier properties and accept lower cap rates for safe, turnkey assets in prime locations.
Price per unit (PPU), on the other hand, is a proxy for replacement cost and intrinsic basis. It asks a simple question: what is it costing me to acquire one door in this specific neighborhood? If you buy a four-unit building for $1,000,000, your price per unit is $250,000. Many investors look at PPU to determine their downside protection. If the cost to build a brand new unit from the ground up in Los Angeles is upwards of $500,000, acquiring an existing unit for $250,000 feels like a mathematically sound basis, even if the property requires some cosmetic updating.
The tension in Los Angeles arises because these metrics frequently contradict one another. You might evaluate a 1960s apartment building in Mid-City that is trading at a dismal 4.5% in-place cap rate. On paper, a 4.5% yield in a high-interest-rate environment sounds like a terrible investment. However, when you look at the price per unit, you might find it is trading at just $185,000 per door. Why? Because the existing tenants have lived there for twenty years, and the rents are drastically below market value. The low cap rate reflects the artificially suppressed current income, while the low PPU reflects the immense "pro-forma" upside a buyer could unlock over time. Conversely, a newly built complex in the same neighborhood might boast a very healthy 5.75% cap rate, but trade at an eye-watering $550,000 per door. The cash flow is there on day one, but the buyer is paying a massive premium for the privilege of not having to execute a value-add business plan.
How Los Angeles Rent Control (RSO) Skews the Metrics
- The RSO Cutoff: Properties built on or before October 1, 1978, fall under the City of LA's Rent Stabilization Ordinance, capping annual rent increases.
- Loss-to-Lease: The gap between what long-term tenants currently pay and what the open market would dictate for a vacant unit.
- Pro-Forma Underwriting: Buyers of RSO properties often ignore the in-place cap rate, choosing instead to value the building based on its future potential once units eventually turn over.
- The Costa-Hawkins Anchor: State law allows landlords to reset rents to market rate once a tenant voluntarily vacates, preserving the long-term PPU upside.
There is no way to discuss multifamily valuations in Los Angeles without diving deeply into the impact of the Rent Stabilization Ordinance (RSO). If your property was built on or before October 1, 1978, and is located within the City of Los Angeles, it is subject to strict local rent control. Following a prolonged multi-year freeze stemming from the pandemic, the allowable annual rent increase for RSO properties in 2024 was capped at just 4%.
This regulatory framework creates what industry professionals call "loss-to-lease." Imagine you own a duplex where one side is occupied by a tenant who moved in during the late 1990s. They might be paying $1,200 a month for a two-bedroom unit. If that tenant were to move out tomorrow, you could legally perform some light renovations and rent the exact same unit to a new tenant for $2,800 a month. That $1,600 monthly difference is your loss-to-lease.
Because of this dynamic, RSO assets often trade at incredibly low in-place cap rates—frequently in the 4.75% to 5.5% range—despite featuring lower PPUs ($180,000 to $275,000). The current Net Operating Income is severely depressed by the sub-market rents. Savvy buyers in Los Angeles know this. They are not underwriting your building based on the 4.75% yield it generates today; they are underwriting to the *pro-forma* upside. They are calculating what the property will be worth in five or ten years as units naturally turn over.
This entire investment strategy is anchored by the Costa-Hawkins Rental Housing Act of 1995. Costa-Hawkins protects "vacancy decontrol," which is a landlord's right to reset an apartment's rent to the open market rate once a tenant voluntarily vacates or is evicted for just cause. Without Costa-Hawkins, the incentive to buy older, low-cap-rate RSO buildings would evaporate, and property values would plummet. By contrast, newer buildings (post-1978 or post-1995) that are exempt from strict local RSO trade much closer to actual replacement cost. These assets boast higher PPUs ($400,000 to $650,000+) and tighter, market-clearing cap rates (5.25% to 5.75%) because their income streams are already fully stabilized at market levels.
Submarket Breakdown: Westside to South Bay
- Prime Westside Markets: Santa Monica, Venice, and Brentwood command the highest PPUs and lowest cap rates due to intense tenant demand and limited inventory.
- Mid-Market & South Bay: Areas like Culver City, El Segundo, Redondo Beach, and Torrance offer a balanced mix of steady workforce housing, moderate PPUs, and stable yields.
- Value-Add Workforce Hubs: South LA, Hawthorne, and Lawndale provide lower barriers to entry (lower PPUs) but come with higher management intensity and slightly higher cap rates.
- Flight to Quality: Buyers are increasingly looking toward municipalities outside the City of LA to avoid stringent rent controls and transfer taxes.
Los Angeles is not a monolith; it is a sprawling collection of distinct micro-economies. The way cap rates and PPU interact changes dramatically depending on whether your building is located steps from the sand or deep in the San Fernando Valley. Understanding these geographic nuances is critical for accurately modeling your multifamily valuation.
| Submarket Category | Average Monthly Rent | Average Cap Rate | Average Price Per Unit (PPU) |
|---|---|---|---|
| Prime Westside (Santa Monica, Venice) | $3,100 – $3,800 | 4.85% – 5.35% | $450,000 – $700,000+ |
| Mid-Market / South Bay (Culver City, Torrance) | $2,200 – $2,600 | 5.25% – 5.85% | $275,000 – $375,000 |
| Workforce / RSO (South LA, Lawndale) | $1,650 – $2,100 | 5.50% – 6.50%+ | $175,000 – $240,000 |
Let's look at the Prime Westside. Communities like Santa Monica, Venice, West LA, and Brentwood are the crown jewels of the Los Angeles rental market. The barriers to new development here are extraordinarily high, meaning existing inventory is highly coveted. I recently closed a 5-unit property at 1332 10th St in Santa Monica for $2,565,000, and a 4-unit property at 705 Flower Ave in Venice for $1,775,000. In these prime coastal zones, buyers are willing to accept very low going-in cap rates—often under 5%—because the tenant base is incredibly strong, appreciation is historically reliable, and the PPU routinely exceeds $500,000. An investor buying in Santa Monica is rarely looking for day-one cash flow; they are parking capital in an irreplaceable location.
Moving inland and south, we find the Mid-Market and South Bay regions, encompassing Culver City, Palms, Westchester, El Segundo, Manhattan Beach, Hermosa Beach, Redondo Beach, Torrance, and down into the Palos Verdes Peninsula (Rancho Palos Verdes, Rolling Hills Estates). These submarkets offer a more balanced investment profile. Rents are healthy, typically ranging from $2,200 to $2,600, and properties trade at a more moderate PPU of $275,000 to $375,000. Because many of these cities (like Torrance or El Segundo) are their own incorporated municipalities, they often bypass the most restrictive City of LA regulations, making them highly attractive to investors seeking stable yield without overwhelming bureaucratic friction.
Finally, we have the Workforce and RSO-heavy markets, such as South LA, East LA, Hawthorne, Gardena, Lomita, and Carson. These areas provide the lowest barriers to entry, with PPUs often hovering between $175,000 and $240,000. While the average rents are lower ($1,650 to $2,100), the in-place cap rates tend to be higher (5.50% to 6.50%+) to compensate investors for the perceived management intensity and older building stock. However, it is vital to note that published cap rate indices often skew these averages. Wide dispersion exists based on actual rent collections versus stated rent rolls, particularly given the prolonged eviction timelines currently plaguing Los Angeles County courts.
The Impact of Measure ULA and Other Legislative Hurdles
- Measure ULA (Mansion Tax): Imposes a massive 4% gross transfer tax on sales over $5.15M, and 5.5% on sales over $10.3M within the City of LA.
- AB 1482 (Tenant Protection Act): Statewide rent control that caps increases on non-RSO buildings older than 15 years, slightly dampening aggressive value-add pro-formas.
- SB 8 (Housing Crisis Act): Mandates one-for-one replacement of protected units, significantly complicating teardowns and development plays.
- The ULA Pricing Cliff: Sellers must model their exits on a net-after-tax basis, as falling just over the $5.15M threshold can result in less actual profit than selling for a lower gross price.
The regulatory environment in Los Angeles has fundamentally altered how investors calculate price per unit and cap rates. The most glaring example of this is Measure ULA, colloquially known as the "Mansion Tax." Enacted recently for properties located strictly within the City of Los Angeles, Measure ULA imposes a gross transfer tax of 4% on real estate sales of $5.15 million or more, and a 5.5% tax on sales of $10.3 million or more (thresholds adjusted for inflation as of 2024).
This is a tax on the *gross* sale price, not the profit. Its impact on a seller's realized PPU is devastating, creating severe pricing "cliffs" in the market. Imagine a property whose unconstrained market value sits right at $5.25 million. If you sell at $5.25 million, you are hit with a 4% tax ($210,000), leaving you with gross proceeds of $5.04 million before paying commissions and closing costs. In this scenario, you would actually net more money by intentionally pricing and selling the building at $5.14 million to avoid the tax entirely. Buyers are well aware of this dynamic and will not absorb the ULA tax for you. Consequently, we are seeing institutional capital aggressively flee the City of LA in favor of non-ULA municipalities like Beverly Hills, Culver City, Redondo Beach, and Torrance.
Beyond ULA, investors must also navigate AB 1482, the California Tenant Protection Act. This statewide law essentially acts as a softer form of rent control for buildings that are older than 15 years but do not fall under local RSO. It caps annual rent increases at 5% plus the local CPI (up to a maximum of 10%) and requires just-cause for evictions. While less restrictive than the City of LA's RSO, AB 1482 still limits the speed at which a new owner can aggressively push rents, meaning value-add pro-formas must be underwritten over a longer time horizon.
Finally, the specter of SB 8 (the Housing Crisis Act) looms over older properties with low PPU that might otherwise be prime candidates for redevelopment. SB 8 mandates the one-for-one replacement of protected affordable units and requires substantial relocation assistance if you intend to demolish residential units to build something new. This dramatically increases the risk and cost of development, which in turn dampens the land value and the price developers are willing to pay per unit for teardown assets.
Strategic Takeaways for Los Angeles Multifamily Owners
- Model Net-After-Tax Pricing: Always evaluate your property's value based on what you will actually keep, strictly monitoring the $5.15M Measure ULA threshold.
- Prioritize DSCR Over Speculation: In a high-interest-rate environment, your Debt Service Coverage Ratio is more important than theoretical future upside.
- Avoid Aggressive Cash-for-Keys: The days of easily executing tenant buyouts to flip a building in 18 months are largely over; plan for longer hold periods.
- Audit Your Collections: Ensure your in-place cap rate calculations reflect actual cash collected, not just the stated rent roll, to avoid bad debt surprises.
Given this complex web of metrics and regulations, how should a Los Angeles multifamily owner position themselves today? First and foremost, you must mind the "ULA Discount Band." If your asset is currently valued anywhere between $5.15 million and $5.5 million, we need to have a serious conversation about pricing strategy. Your exit modeling must be conducted on a net-after-transfer-tax basis. Frequently, the smartest move is to strategically price just under the threshold, ensuring maximum net proceeds and avoiding a prolonged listing period where buyers try to force you to eat the tax burden.
Secondly, in today's high-interest-rate environment, you must prioritize margin over "per-unit" rules of thumb. Relying purely on a low PPU to justify buying a rent-stabilized building is dangerous when debt is expensive. With slower tenant turnover and strict tenant protections, the time required to organically convert a 4.5% in-place cap rate into a 7% market yield takes significantly longer than it did during previous market cycles. Instead of relying on speculative, high-cost "cash-for-keys" tenant buyouts, you should underwrite your investments based on a solid Debt Service Coverage Ratio (DSCR) and acceptable current cash-on-cash yield.
Finally, be hyper-vigilant about the discrepancy between gross potential rent and actual collections. In-place cap rates based on stated rent rolls often look better than reality. Post-pandemic bad debt and heavily backlogged eviction courts in Los Angeles County mean that what a tenant owes is not always what they pay. If you are considering a 1031 exchange or simply rebalancing your portfolio, you need an advisor who looks beyond the surface-level metrics to uncover the true financial health of an asset.
As a multifamily advisor, my goal is to help you cut through the noise and make decisions based on real, actionable data. Whether you are holding generational assets on the Westside or looking to expand your footprint in the South Bay, understanding the intricate dance between cap rates and price per unit is your strongest defense against an unpredictable market. If you are curious about how these local laws and metrics currently impact the value of your specific property, I invite you to reach out. We can review your rent roll, analyze your submarket, and map out a strategy that protects your wealth and maximizes your returns. Let's schedule a no-pressure strategy session to discuss your next move.
Frequently asked questions
Which is more important when valuing an LA apartment building: cap rate or price per unit?
Neither metric should be used in isolation. Cap rate is crucial for understanding your day-one cash flow and ability to cover debt service, while price per unit (PPU) indicates your underlying basis and long-term value-add potential. In Los Angeles, a low cap rate combined with a low PPU often signals a strong long-term upside opportunity due to suppressed RSO rents.
How does Measure ULA affect my property's price per unit?
Measure ULA imposes a 4% gross tax on sales over $5.15M (within the City of LA). Because the seller bears this gross tax, it essentially lowers your net price per unit proceeds. For properties valued just over the threshold, sellers often realize a higher net PPU by pricing slightly under $5.15M to avoid the tax entirely.
Why do buildings in Santa Monica and Venice sell at such low cap rates?
Prime Westside markets feature extreme barriers to entry, highly affluent tenant bases, and limited inventory. Buyers in these areas are often parking capital for long-term appreciation and wealth preservation rather than seeking high immediate cash flow, driving up the price per unit and compressing cap rates below 5%.
What is the difference between the City of LA's RSO and AB 1482?
The City of LA's Rent Stabilization Ordinance (RSO) generally applies to buildings constructed before October 1978 and is highly restrictive, currently capping rent increases at just 4%. AB 1482 is a statewide law applying to non-RSO buildings older than 15 years, allowing slightly more generous rent increases (5% plus CPI) but still mandating just-cause evictions.
RELATED READING